Liquid is an online cryptocurrency exchange where you can trade a wide range of fiat/crypto and crypto/crypto currency pairs. Its World Book order book combines a global network of liquidity sources in order to provide access to a higher level of liquidity and better price matching.
The site also offers Liquid Margin, where you can trade with up to 25x leverage, and has its own utility token known as QASH. You can use QASH to pay for services on Liquid, and at the time of writing (September 2018), it was soon to undergo a rebrand to become Liquid Token (LQD).
Liquid’s parent company, Quoine, is headquartered in Tokyo and is licensed by the Japanese Financial Services Agency. Quoine was founded in 2014 and launched Quoinex, a fiat-to-crypto trading platform, in the same year.
In 2017, the company launched a crypto-to-crypto exchange known as Qryptos, and in the 12 months to July 2018, the two platforms handled a combined total of more than US$50 billion in transactions.
In September 2018, Liquid was formed from the amalgamation of Quoinex and Qryptos.
Services
Most of Liquid’s trading activity comes from its fiat trading pairs, dominated by its USD and JPY markets. The exchange also offers a huge range of other trading pairs based in other fiat currencies, as well as crypto-to-crypto trading pairs for more than 100 coins and tokens.
Hex is easily, the most controversial crypto analysis project the Veritaseum research team has performed to date. This analysis is sure to make some waves. It contains a project overview, detailed project description, a strengths section, risks and liabilities and a token valuation. The "Risks and Liabilities" section is sure to turn some heads.
Importantly, it should be noted that we are not declaring HEX a Ponzi scheme. We are not lawyers, and such a declaration requires a legal conclusion better suited to be resolved by the courts. However, from a forensically analytical investor’s perspective, this issue is deserving of very careful consideration to avoid unanticipated events that can severely affect an investment. Below, please find an illustration of a hybrid Ponzi/Pyramid scheme, with characteristics of a typical Ponzi scheme on the right and the characteristics we perceive to be inherent in HEX on the left.
It is common for many to conflate the terms “Ponzi scheme” and “pyramid scheme”. A Ponzi scheme, as noted above, involves a promoter who has no real investment opportunity. The promoter simply collects payments from a stream of investors, promising them all the same high rate of return on their investment.
Surprise fall in unemployment rates in the US – A closer look
While many economists and analysts predicted the rates to go up and as far as 20%, the decline in the rates was highly unexpected.5th of June, 2020 brought in a surprising piece of news for the US economy – the unemployment rates were down to 13.3% in May 2020, compared to the 14.75% recorded in April 2020, as the economy added 2.5 million jobs to its pocket.
Total nonfarm payroll employment increased by 2.5 million in May 2020. The improvements in the labor market reflected a limited renewal of economic activity that had been curtailed in March and April due to the coronavirus (COVID-19) pandemic and efforts to contain it.
In May 2020, employment rose sharply in leisure and hospitality, construction, education and health services, and retail trade. By contrast, employment in the government sector continued to decline sharply.
Major Reason bolstering the rebound in employment rates
The Paycheck Protection Program (PPP)
In the wake of the COVID-19 pandemic relief, which distorted the US economy by a significant amount, the US government announced a US$669 billion business loan program called the ‘Paycheck Protect Program’ (PPP) for small businesses, self-employed workers, certain nonprofit organizations, sole proprietors, and tribal businesses to help them continue paying their workers
The said program provided relief to small businesses through loans that wouldn’t have to be paid back if most of the money went to rehire and pay employees
According to the data of the Labor Department, the businesses started receiving PPP money by late April and early May 2020 which triggered the growth in employment across the country
The May-2020 job gain is suggestive of the fact that thousands of stores, gyms, restaurants, and several other companies reopened and rehired more quickly than many analysts had forecast.
Highlights of the PPP scheme
All small businesses are eligible for the loan
The loan has a maturity rate of 2 years, and an interest rate of 1%
No requirement to make loan payments for the first six months
No collateral or personal guarantees are required
No fees
The loan covers expenses for eight weeks beginning from the loan origination date (if the obligations began before 15th of February 2020)
The loan can be forgiven and essentially turned into a non-taxable grant
Key guidelines of the PPP scheme
At least 75% of the PPP loan must be used to fund payroll and employee benefit costs. The remaining 25% can be spent on,
Mortgage interest payments
Rent and lease payments
Utilities
The PPP scheme rolled in by the US government through the Coronavirus Aid, Relief, and Economic Security Act (CARES Act), provided the much-needed cash injection into the US economy.
However, the rate of the loan approvals in the current package seems to have slowed down as the funds start to dry up. Though the financial impetus helped in regaining 2.5 million jobs in the month of May 2020, it should be noted that the unemployment rate in the country is still much above the mark of 10%, which the country faced during the times of the Great Recession. Thus, there still exists a huge number of Americans waiting to get employed. This is not even the bad news!
What created the gap in the expected rate and the actual rate of unemployment in May 2020?
By the 16th of May, 2020, more than 38 million Americans filed unemployment claims, which implied an unemployment rate of 20%. This number was several million more than that filed at the end of April. However, the trend changed as the stimulus package rolled in, and some of those workers who had previously filed unemployment claims started going back to work. Notably, the fiscal stimulus package (PPP) statutorily has to be consumed within eight weeks (although an extension may have been recently signed).
What do the real economic numbers look like, ex-stimulus?
The average US worker makes US$69,181 per year or US$5,765 per month. We’re using the average number because the median number would skew lower and the salary cap for PPP reimbursement is US$100k – allowing higher-paid employees to max out at US$100k. By taking the two months (PPP) limit of the average annual salary, we can reasonably guess the number of jobs in the recent past payroll report directly and entirely funded by the American taxpayer. That 2.5 million job gain was actually a 9.8 million job loss if the taxpayer-funded bailout was not considered. Why leave this out? Because:
It does not reflect natural, organic job growth; and
It is only for two weeks! After that, either employers will have to pay employment costs out of revenues or will have to let those employees go again. After three months of lockdown, back rent, ruptured supply lines and COVID muted demand – what do you think will happen when the free money runs out?
The financial help, once dried up, might lead to the second wave of the rise in unemployment rates, adding much to the worries of the already struggling economy. Hence, if the economy is to rebound strongly, then stimulus of a higher magnitude is of utmost necessity. However, the question that persists is how feasible it is for a consistent and constant fiscal stimulus to be funded by US taxpayers – the same taxpayers receiving the stimulus! Therein lies the conundrum, the US must rob Peter to pay Paul! In other parlance, this is known as a Ponzi scheme.
Bank of America ("BOA or the Bank"), the 2nd largest Bank in the US by asset size, has exceeded its earnings expectation and reported a net income of USD3.53 billion in Q2 2020. However, the net revenues reported for Q2 2020 is USD22.5 billion, barely edged out analysts' estimates of USD22 billion. Net income of the Consumer Banking segment is reported at USD71 million in the 2Q 2020, which has drastically declined from USD1.8 billion recorded in Q1 2020. Federal Governments' emergency rate reductions have curbed the Bank's net interest income. The Bank has reported a net interest income of USD10.85 billion in Q2 2020, which has declined from its previous quarter as well as last year's period value. However, the non-interest income has increased and reported an income of USD11.48 billion compared to USD10.64 billion in Q1 2020 and USD10.90 billion in Q2 2020. Net interest yield rate stood at 1.87% in Q2 2020 compared to 2.33% in Q1 2020. The Bank has maintained a provision of USD5.12 billion for credit losses in Q2 2020.
BOA is feeling the effects of COVID-19 more acutely as its business is more consumer-focused. The plunge in “real” economic activity” and “actual” economic value of BOA has placed downward pressure on the Bank's consumer banking segment, which is tied to the health and financials of millions of American consumers and borrowers. Hence, BOA is considered as the most sensitive of the large banks by analysts when it comes to fluctuation in interest rates.
Let us get a detailed view of its earnings.
Net Income
BOA has reported a net income of USD3.5 billion in Q2 2020 compared to a net income of USD7.3 billion in Q2 2019. Net income of the Bank's major segment, i.e., Consumer Banking, has declined drastically in Q2 2020 and reported a net income of USD71 million compared to USD3.3 billion in Q2 2019. This is primarily due to Federal Governments emergency cut in interest rates as well as rising unemployment. The Global Wealth & Investment Management segment reported a net income of USD624 million in Q2 2020, which has also declined from the USD1.08 billion in Q2 2019. The Global Banking and Global Market segment's net income in Q2 2020 have declined from the same quarter previous year but has increased from the previous quarter's income. Net income of Global Banking and Global Market segments reported at USD726 million and USD1.90 billion in Q2 2020 compared to USD136 million and USD1.71 billion in Q1 2019. Other net income has increased to USD216 million in Q2 2020, from a net loss of USD493 million in Q1 2020 and USD9 million in Q2 2019.
Figure 1: Bof A Segment-wise Net Income Trend (in USD millions)
Source: Bank of America Earnings Release, 2Q 2020
Net Interest Income & Non-Interest Income
BOA reported a net interest income of USD10.85 billion in Q2 2020 compared to USD12.19 billion in Q2 2019. The net interest income has declined with interest rate cuts by the Federal Reserve. However, non-interest income has increased to USD11.48 billion in Q2 2020 from USD10.90 billion in Q2 2019, primarily because of an increase in underwriting income and financial advisory services.
Figure 2: B of A Net Interest Income & Non-Interest Income (in USD millions)
Source: Bank of America Earnings Release, 2Q 2020
Profit Provisioned for Credit Losses
BOA reserved 72% of its pre-provision profit as a provision for credit losses. The Bank has provisioned 97% of total Consumer Banking segment profit for credit losses followed by Global Banking segment with a provision of 65.3% of the pre-provision profit. The Bank has reserved 14.1%, 3.9% and 3.7% pre-provision profit of Global Wealth & Investment Management, Global markets and other segments, respectively.
Figure 3: B of A Profit Provisioned for Credit Losses (in %)
Source: Bank of America Earnings Release, 2Q 2020
Return-on-Equity (ROE)
BOA's ROE has declined to 5.3% in the Q2 2020 from 11.0% in Q2 2019. The drastic decline in the Consumer Banking profit has impacted the ROE of the Bank.
Figure 4: B of A Return-on-Equity (in %)
Source: Bank of America Earnings Release, 2Q 2020
Net Interest Margin
The net interest margins is an indicator of the Bank's ability to lend money at an interest rate higher than the interest rate it pays on its deposits. The emergency cut of interest rate by the Fed has put downward pressure on its net interest margins. Notably, net interest rate margin of BOA has declined from 2.4% in Q2 2019 to 1.9% in Q2 2020.
Figure 5: BofA Net Interest Margin (in %)
Source: Bank of America Earnings Release, 2Q 2020
Balance Sheet Interest Rate Analysis
Earning Assets
The interest rate of BOA declined in Q2 2020. The interest rate of trading assets declined primarily because of a significant decline in the interest rates of Federal deposits, time deposits and short-term investments and Federal securities borrowed under the agreement of reselling in Q2 2020. The interest rate of commercial assets has declined primarily because of a decline in interest rates of the commercial real estate sector. The interest rate of the Consumer Banking segment declined with the decline in the interest rates of home equity sector.
Figure 6: Earning Assets Interest Rate Analysis (in %)
Source: Bank of America Earnings Release, 2Q 2020
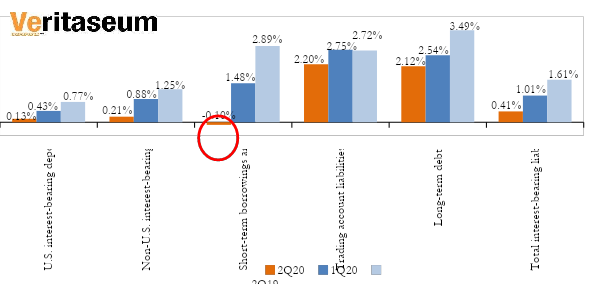
Interest-bearing liabilities
The rates of interest-bearing deposits of BOA have also declined in Q2 2020. The interest rates of short-term borrowings and other interest-bearing liabilities have significantly declined and reached -10% in Q2 2020. The interest rates of total interest-bearing liabilities have declined to 1.61% in Q2 2020 from 0.41% in Q2 2019.
Bank of America is, in real time, refuting the erroneous assumption that inter-bank interest rates cannot go below zero because a lender would prefer to hold on to its money and receive no return rather than pay someone to borrow the money. This may be true for uncollateralized loans, but a lender may be willing to pay interest if the securities offered as collateral on a loan allow it to meet a delivery obligation (D’Avolio 2002; Jones and Lamont 2002), i.e. treasuries or certain equities. These are the treasury FTDs (fail-to-delivers) for the month of June. Which bank do you think is proximal to these FTDs on the 11th of June?
Figure 7: Interest Rate Analysis of Interest Bearing Deposits (in %)
Source: Bank of America Earnings Release, 2Q 2020
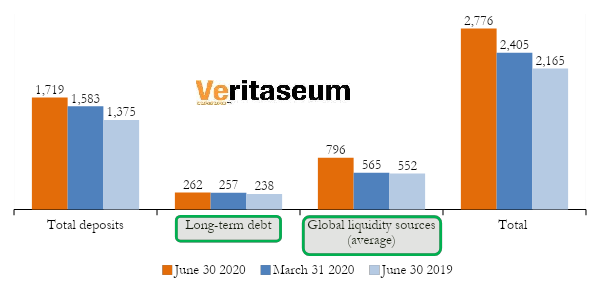
Funding and Liquidity
BOA's liquidity position in Q2 2020 has improved from Q2 2019. In Q2 2020, the Bank's liquidity position stood at USD2,776 billion.
Figure 8: Funding and Liquidity (in USD billion)
Source: Bank of America Earnings Release, 2Q 2020
Global Liquidity Sources include cash and high-quality, liquid, unencumbered securities, inclusive of US government securities, US agency securities, US agency MBS, and a select group of non-US government and supranational securities, and other investment-grade securities, and are readily available to meet funding requirements as they arise. Federal Reserve Discount Window or Federal Home Loan Bank borrowing capacity is excluded from the source.
Commercial Credit Exposure by Company
Credit exposure is the measurement of the maximum potential loss to a lender if the borrower defaults on payment. It is a calculated risk to doing business as a bank. The global pandemic has significantly affected industries, resulting in lost revenues and disrupted supply chains on account of lockdown measures and there residual effects. Industries such as real-estate, retailing, consumer services, food beverage and tobacco, transportation, consumer durables and apparels, vehicle dealers and automobile and components are highly susceptible due to lockdowns and restriction measures. BOA has a significant amount of credit exposures to these sectors.
Particulars
Commercial Utilized
Total Commercial Committed
June 30th 2020
March 31st 2020
June 30th 2019
June 30th 2020
March 31st 2020
June 30th 2019
In USD billions
Asset managers and funds
64.2
75.6
70.2
100.8
111.5
108.0
Real estate
74.2
76.0
66.9
96.1
95.8
89.7
Capital goods
47.7
48.3
39.6
85.7
85.5
75.1
Finance companies
40.7
46.1
39.1
63.8
66.6
62.9
Healthcare equipment and services
39.7
40.7
35.4
63.8
58.7
57.1
Government and public education
43.8
45.2
42.4
56.0
56.3
54.4
Materials
28.8
30.7
27.9
52.4
53.3
52.3
Retailing
29.6
33.5
26.5
49.8
49.5
47.9
Consumer services
34.2
34.8
25.8
48.3
46.3
47.2
Food, beverage and tobacco
24.6
28.0
25.4
46.2
47.8
45.6
Commercial services and supplies
24.7
25.6
22.2
38.1
36.8
37.8
Energy
17.0
18.3
15.0
37.4
38.0
37.4
Transportation
26.3
28.2
24.8
35.5
36.5
34.5
Utilities
13.3
14.5
12.1
30.0
31.7
31.3
Individuals and trusts
20.5
20.1
18.9
28.4
28.7
25.8
Global commercial banks
25.1
31.3
28.4
27.5
33.5
31.4
Media
14.5
13.6
12.1
26.4
24.5
24.8
Technology hardware and equipment
10.3
12.8
9.4
22.5
23.8
21.7
Consumer durables and apparel
10.9
12.6
10.3
21.1
20.5
20.0
Software and services
11.7
11.3
10.4
21.0
19.8
19.7
Vehicle dealers
15.4
18.3
17.7
19.8
21.2
20.8
Automobiles and components
12.4
11.8
7.8
18.6
17.3
15.0
Pharmaceuticals and biotechnology
6.8
6.3
6.1
17.6
19.6
16.5
Insurance
6.8
7.9
6.1
14.2
15.3
13.2
Telecommunication services
7.9
10.1
8.9
13.6
15.9
15.3
Food and staples retailing
6.4
6.8
5.9
10.6
10.7
9.8
Financial markets infrastructure (clearinghouses)
4.9
7.1
9.7
7.3
9.5
11.4
Religious and social organizations
5.4
4.4
4.0
7.2
6.1
5.9
Total commercial credit exposure by industry
667.7
719.9
628.8
1,059.5
1,080.7
1,032.5
BOA's total committed commercial credit exposure as on June 30, 2020 stood at USD1,060 billion, and total utilized commercial credit exposure stood at USD668 billion. BOA has the highest credit exposure in ‘asset managers and funds’ segment (expect this to get drawn upon when leveraged long or short positions go awry), followed by the ‘real estate’ sector (‘nuff said) and ‘capital goods’ market (straight consumer exposure during and economic depression).
As of June 30 2020, the total committed credit exposure of ‘asset management’ sector stood at USD101 billion out of which USD64.2 billion credit has been utilized. BOA's total committed credit exposure in the real estate sector (the hardest hit sector by the pandemic) stood at USD96.1 billion in Q2 2020 out of which USD74.2 billion is utilized.
Non-Performing Loans (NPLs)
BOA reported total non-performing loans of USD4.4 billion in Q2 2020 compared to NPLs of USD4.2 billion in Q2 2019. The Bank’s NPLs has increased with an increase in the NPLs of commercial loans.
Total NPLs in the consumer loan segment has declined in Q2 2020 and reached USD2.2 billion from USD3.0 billion in Q2 2019. The NPLs declined primarily because of a decline in NPLs of home equity loans as the Bank has charged-off a significant portion of loans during the one-year period.
Figure 9: Non-Performing Loans – Consumer Loans (in USD billion)
Source: Bank of America Earnings Release, 2Q 2020
However, Commercial sector NPLs increased in Q2 2020. The total commercial NPLs in Q2 2020 stood at USD2.2 billion compared USD1.2 billion in Q2 2019 (an 83.3% YoY increase). The Commercial sector NPLs increased with the increase in the US commercial, Non-US commercial and commercial real estate sector. The NPL related to commercial, Non-US commercial and commercial real estate sector stood at USD1.2 billion, USD387 million and USD474 million in Q2 2020 compared to USD820 million, USD122 million and USD112 million in Q2 2019 respectively.
Figure 10: Non-Performing Loans – Commercial Loans (in USD billion)
Source: Bank of America Earnings Release, 2Q 2020
Loan Delinquency rate and Charge-off
BOA, in its 2Q 2020 results reported 30+ days loan delinquency rate of 1.7% in the Consumer Banking segment (credit cards). The delinquency rate of credit card loans have not changed much throughout the last five quarters and even declined in Q2 2020.
Figure 11: 30+ Days or More Loan Delinquency Rate – As Reported (in %)
Source: Bank of America Earnings Release, 2Q 2020
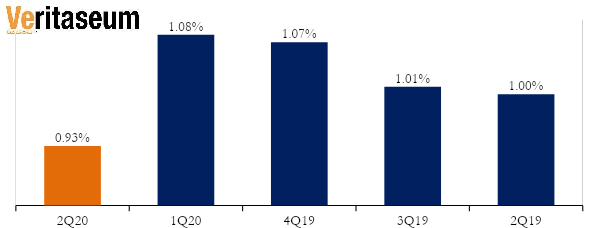
A similar scenario is seen in the 90+ days or more credit card delinquency rates also. The loan delinquency rate of 90+ days or more has also declined in Q2 2020 from its previous quarter's level. In Q2 2020, the Bank has reported 90+ days or more delinquency rate of 0.93%.
Figure 12: 90+ Days or More Delinquency Rate – As Reported (in USD millions)
Source: Bank of America Earnings Release, 2Q 2020
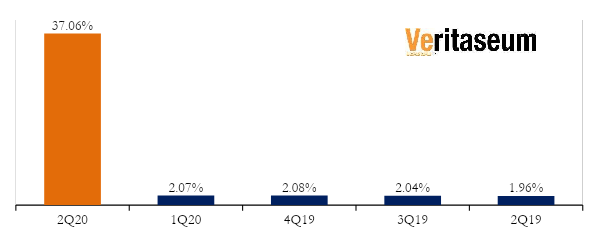
The above data is as reported in BofA’s earnings release. But if we delve in, we can see a completely different picture of the delinquency rates of credit cards. The actual, economic delinquency rates have a considerable difference than the reported one.
On March 16th 2020, BOA enacted the Client Assistance Program where it offers assistance to 66 million consumers and small business clients in response to the unprecedented challenges of COVID-19, allowing the clients to defer payments. BOA has processed approximately 1.8 million total deferrals, and as of July 9th, the Bank still has 1.7 million deferrals. The deferrals represent USD29.8 billion of consumer balances.
If we add back this deferral amount to the reported delinquency amount of credit cards a completely different, and in our professional opinion – a considerably more revealing, honest and informational, scenario in delinquency rates comes out. The actual 30+ days and delinquency rate is 37.1% compared to the reported 30+ days delinquency rate of 1.7%. That is a difference of nearly 2,200%! Misleading, to put it lightly.
Figure 13: 30+ Day Delinquency Rate w/COVID Emergency Deferrals, As Adjusted by Veritaseum Research (in %)
Source: Veritaseum Research
BOA's actual 30+ day consumer loans delinquency amount stood at USD31.2 billion in Q2 2020 compared to reported 30+ day delinquency amount of USD1.4 billion. More alarming is that BOA's allowance for loan losses in Q2 2020 is USD9.2 billion, which is only 30% of the actual delinquent amount.
Figure 10: 30+ Day Delinquency Rate w/COVID Emergency Deferrals, As Adjusted by Veritaseum Research (in USD billions)
Source: Veritaseum Research
Conclusion
The US economy has been experiencing a significant and unprecedent material slowdown over the past few quarters due to the global pandemic, COVID-19 in combination with the deflation of a drawn out bubble that’s been blowing for over a decade. The pandemic has affected businesses with lost revenue and disrupted supply chains on account of lockdown measures. Industries such as Retailing, Consumer Services, Food Beverage and Tobacco, Transportations etc. are the worst affected and are highly susceptible. BOA has a significant amount of credit exposures in these sectors, signifying a huge impact on its earnings.
However, BOA in its Q2 2020 earnings has surpassed the earnings expectations and reported a net income of USD3.5 billion. The Bank's Consumer banking segment was hugely affected by the emergency interest rate cuts by the Federal Government and reported a net income of USD71 million. The Bank has reported USD11.5 billion non-interest income which has increased in this quarter primarily because of an increase in underwriting income and financial advisory services. However, the ROE and the net interest margin of BOA has declined in Q2 2020.
BOA has a provisioned 72% of its pre-provision GAAP earnings for credit losses in Q2 2020. The Bank's liquidity position has improved from the previous quarter and stood at USD2,776 billion. The Bank's NPLs were reported at USD4.4 billion.
The Bank's delinquency rates have declined and have reported a delinquency rate of 1.7% in Q2 2020. This is mainly because the Bank has enacted the Client Assistance Program under which it has allowed its clients to defer payments and excluded the total deferral amount of USD29.8 billion. Although this may adhere to GAAP (generally accepted accounting principles) guidelines, it is tantamount to prestidigitation and misdirection. This provides a misleading picture of the Bank’s financials. When we add back the amount set under the program, the delinquency rate increases to 37.06%. This indicates a big wave of defaults expected to come in the next few quarters, of which BofA is woefully under-provisioned for. Although BofA is in particularly bad shape in the is regard, it is not alone. JP Morgan, the largest bank in the US by assets, and arguably one of the better managed banks, is in the exact same predicament, using the exact same parlour tricks to hide the credit quality damage to tis balance sheet. Reference “Analysis of JP Morgan's Terrible, Horrible, No Good 2nd Quarter of 2020 - Why Am I the Only One?”
After posting an article on stagflation yesterday, I noticed that many were in disagreement on what inflation actually amounted to in the real world. Further, many were unaware of what digital gold actually was. I fear they may have been confused by the term "digital". Thus, today we will review the rampant inflation that we are encountering the US (and world-wide) and the effects that it is having on digital gold. But first, let's be clear on nomenclature and semantics, through a glossary of sorts...
What is Monetary Inflation?
Monetary inflation is a sustained increase in the money supply of a country (or currency area, i.e.the EU). The generally accepted economic,definition of inflation is a sustained increase in the general price level of goods and services in an economy over a period of time. What many fail to conceptualize is that the price level of sand goods and services are cast in that country's (or currency area's) currency. Thus, it is really a push and pull dynamic that determines these prices. The push is the amount of actual currency that is in the economy, which is the most sensitive determinant of prices (since, in modern times,money can be electronically printed in hours, if not minutes). If you have $100,000 USD, backed by exactly 100,000 units of GDP, (let's assume 1 unit of GDP = $1 at this time) and there is $1,000,000 in existence. I, the Mr. Central Banker, while in full PANIC mode, adds 49% to the money supply (100% inflation, annualized). Let there be no misunderstand. the Fed literally added IN EXCESS of 49% of the total dollars outstanding to the USD supply since COVID started - November of 2019!
So, I as the Fed banker, adds $490,000 more USD to the system and generously (you know, like in the PPP bailout schema and IRS stimulus checks) give you $7k of it. How much richer are you, economically? Let's do the simple math. You go from $1 in 2019 dollars to $0.67 + the PPP/IRS stimulus payment (let's add .$.007 for that). That is the most rapid, most steep, most destructive jump in monetary inflation in the history of this country. That's ~100% inflation, annualized Zimbabwe had 161% inflation in 2019. We're catching up!
Now, that $1M home you were looking to buy now costs $1.4M, and the owners of that home really feel wealthier. The problem is that they are wealthier in the drastically devalued USD. Economically, they would be the same - give or take a couple of percentage points... Except.... That house didn't go up in price at all.It went down in price. Why?
Prices are going down. This is deflation, and it is the reason why the Fed is pumping so much money into the economy, debasing the dollar. Inflation combined with deflation leads to the stagflation that we discussed yesterday on Zerohedge.
What is Tokenized (Advanced Digital) Gold?
Digital Gold: Gold that is identified in digital form. This is opposed to gold that is identified in analog form. For example, when you purchase gold from a gold dealer and issued a paper receipt for said gold, it is analog. When you purchase gold from a dealer and you are issued a digital receipt (i.e.a blockchain-based token) it is digital. If the digital token is structured properly (i.e. carefully tokenized), it gives you all of the benefits of a traditional purchase, plus all of the benefits of the Internet, the blockchain and the programmability of the smart contracts (i.e. autonomous loans denominated in hard currency). One of the biggest misconceptions of digital gold is that of counterparty risk, basically, "If you don't have it, it's not yours!". Here's a 10-second tutorial on how to alleviate that misconception with VeGold, one of the better implementations of digital gold (disclaimer: I am affiliated with the proprietor of this system)..
Click the "redeem" button on your phone, tablet or computer
Provide a shipping address
Pay for the shipping. You can use USD (or any other fiat, converted to USD) or any other digital metal you may have in your account.
This can be done immediately after you buy the metals (just like a traditional purchase) or next month, next year, in three years, etc. Unlike traditional dealers, you can buy and sell fractional units of gold, as little as $0.40 (forty cents) worth, and transfer that small amount for as little as 4 cents. Properly constructed tokenized gold is literally title to the physical gold, deliverable on demand. It can also be held in bearer form, and freely transferred to others within seconds.
You can also easily send and/or receive your gold tokens to anyone with an Internet connection, in any amount, within seconds and for mere pennies.
These tokens that are digitally sent or received can also be redeemed for physical gold, upon demand, simply by following the steps above (after KYC, of course). This represents a colossal evolution in how physical gold is bought, sold, sent, received and traded.
This chart is the base of the entire argument of holding gold as an currency reserve. First, look at the trend of each component/line.
The economic world has been upended during the popping of the 2007 bubble.
In 2009, the Fed has doubled in balance sheet through quantitative easing, thereafter increasing it by ~700% more through today. It has added more than 30% to its balance sheet in just the last two months.
The broad money supply has jumped 49% in the last 6 months.Monetary inflation is at its highest level, ever, and half of the annualized inflation rate of Zimbabwe.
US borrowing has increased by 300% over the largest period of borrowing in the modern history of this country. There has never been a period where the US has borrowed more, or borrowed as fast.
Gold has tracked this monetary debasement (inflation) closely, now near an all-time high
This is the chart,blown up to focus on just the COVID-19 period.
Comparing the amount of US government borrowing since October ($1,226,672,000,000) to the increase in the amount of US treasuries holdings on the Fed's balance sheet ($1,795,938,000,000), you'd find that the Fed has not only:
been the buyer of all of those treasuries issued by the US (debt monetization), and
has also been soaking up excess treasuries from the (real) secondary markets in order to synthetically give the impression of naturally lower interest rates (the Fed has bought more treasuries than the US has issued.. Two guesses where the money to buy $1.8 trillion of US borrowings came from....
You guessed correctly, the printing of US currency. The monetary base in the US has increased by $1,592,133,000,000, or a whopping 49% - in less than 6 months! That doesn't even tell the whole story. You see, the Fed has been busy buying a lot more than just treasuries. It has bought ETF shares, mortgage backed securities, swapsi issued, etc. It's total asset side of its balance sheet has grown $2,636,106,000,000, again, over a period of less than six months. Money needs to be printed to fund that additional $1.8T worth of "other stuff" the Fed has been stuffing into it's knapsack.
What does this mean for gold when priced in rapidly inflating dollars? Well, over that same 6 month period, gold has climbed 16%, and the money debasement/inflation is literally just getting started.
Look at the correlation between these government activities and he price of gold
Let's look at the price of VeGold (tokenized gold) in various sovereign fiat and crypto currencies.
U.S. Department of the Treasury. Fiscal Service, Means of Financing: Borrowing from the Public [MTSMFBP133FMS], retrieved from FRED, Federal Reserve Bank of St. Louis; https://fred.stlouisfed.org/series/MTSMFBP133FMS, May 20, 2020.
Board of Governors of the Federal Reserve System (US), Assets: Total Assets: Total Assets (Less Eliminations From Consolidation): Wednesday Level [WALCL], retrieved from FRED, Federal Reserve Bank of St. Louis; https://fred.stlouisfed.org/series/WALCL, May 20, 2020.
Board of Governors of the Federal Reserve System (US), Assets: Securities Held Outright: U.S. Treasury Securities: All: Wednesday Level [TREAST], retrieved from FRED, Federal Reserve Bank of St. Louis; https://fred.stlouisfed.org/series/TREAST, May 20, 2020.
Board of Governors of the Federal Reserve System (US), Monetary Base; Total [BOGMBASE], retrieved from FRED, Federal Reserve Bank of St. Louis; https://fred.stlouisfed.org/series/BOGMBASE, May 20, 2020.